
Superstar subtweets, injuries, unexpected rises, embarrassing season stretches, tough streaks, new records, and so much more.
And here’s what we’re looking at:
What a thrilling mess!
Let’s dig into some of the standout teams of this first quarter.
Teams
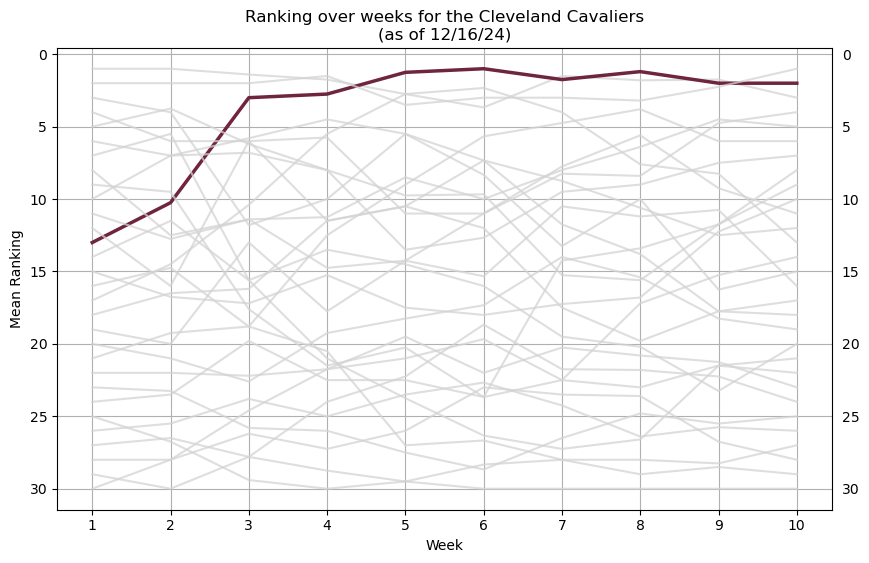
Cleveland Cavaliers
Everyone’s favorite breakout team of the first quarter. Newly installed coach Kenny Atkinson has made the offense sing, answering questions raised in the past regime and a opening the doors for welcome returns-to-form for Darius Garland and Evan Mobley.
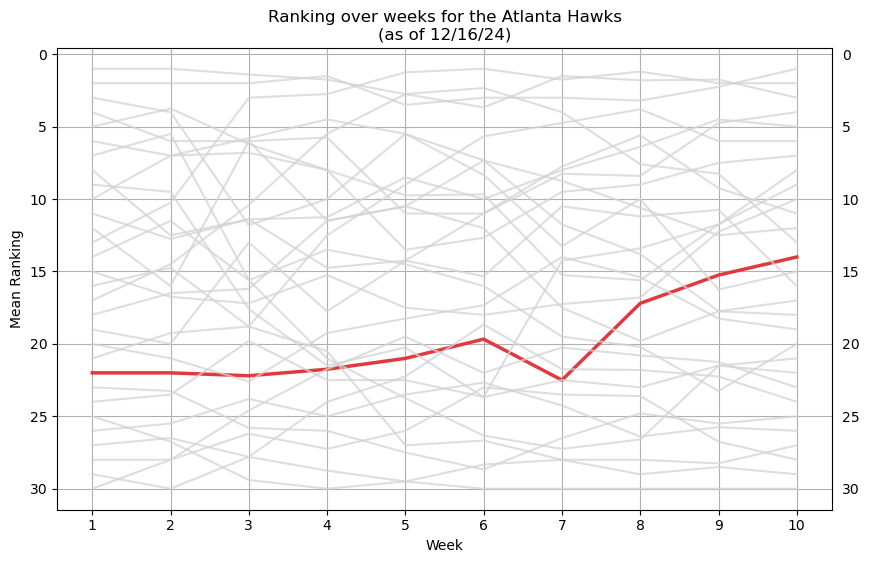
Atlanta Hawks
For years, Atlanta has been a bang-on average team (or as ClutchPoints proclaimed a year ago, “so mid”). Are they starting to find their form around the excellent play of Jalen Johnson, the development of Zaccharie Risacher, and a more engaged Trae Young? Their recent win streak has not been against the most capable of opposition, but winning against bad teams is what good teams are supposed to do…
Philadelphia 76ers
Woof. It took literally two weeks for the glow of a buzzy Sixers offseason to start dimming. Things seem to have stabilized; the team is now merely extremely disappointing rather than monumentally so.
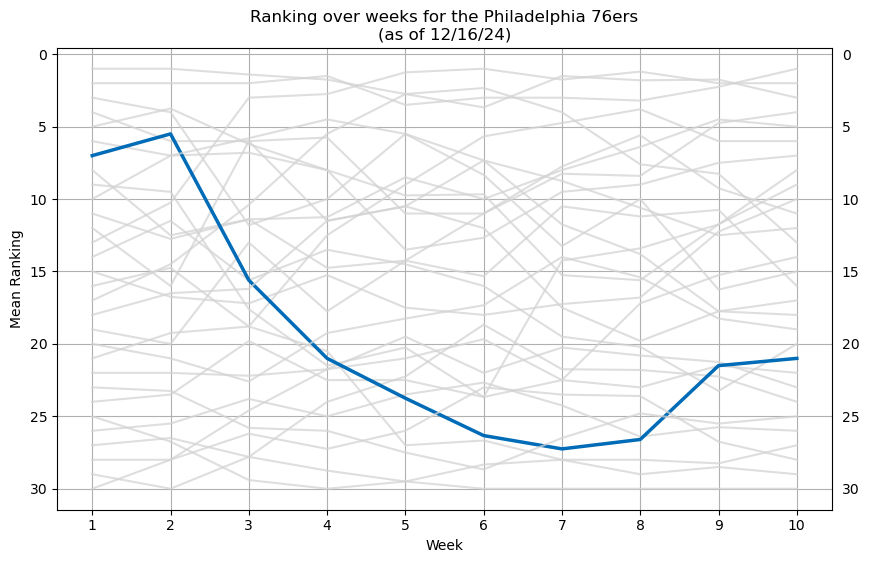
And imagine where they’d be without the two lone bright spots: Tyrese Maxey and future ROY Jared McCain.
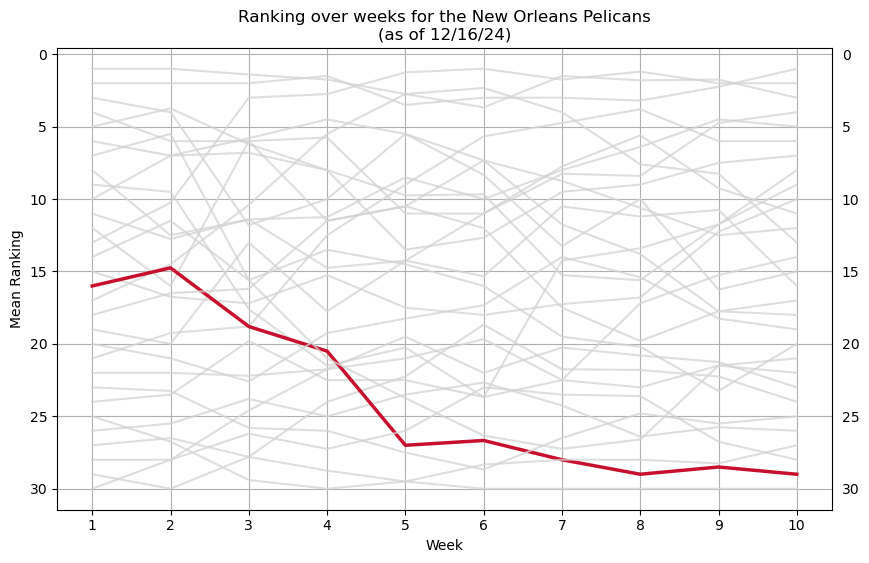
New Orleans Pelicans
Or as I call them, the Gulf Coast Sixers. It once seemed that New Orleans would have to contend with some Big Questions down the line. But the Pels’ extremely unfortunate — and foreseeable — spate of injuries have made these distant dilemmas much more immediate.
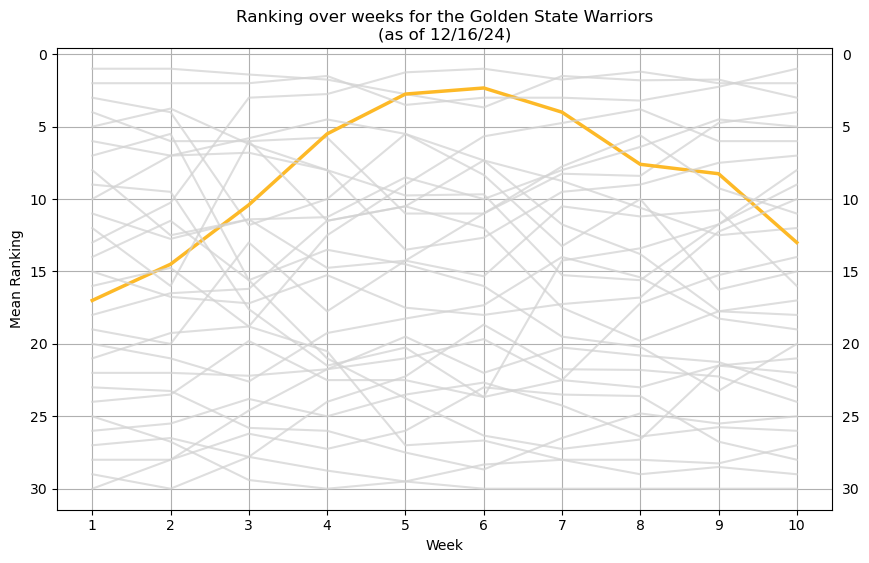
Golden State Warriors
It took a few weeks for the muted Warriors expectations to reach their height. They won early in the season, but the apex came when the team overcame a brief Stephen Curry injury and soared to 4-1 on a strenuous road trip, sealing wins on the courts of Houston, Boston, and OKC (and Washington, whatever). Those good vibes persisted for another week, until the Dubs dropped seven-of-eight.
One trade later, Dennis Schröder, a perennial “hate-him-when-he’s-not-on-your-team” all star, is on the team. We’ll see if he can slot in for De’Anthony Melton, who had the most memorable two game role-player stretch (wins against OKC and Dallas) in my memory as a Warriors fan.
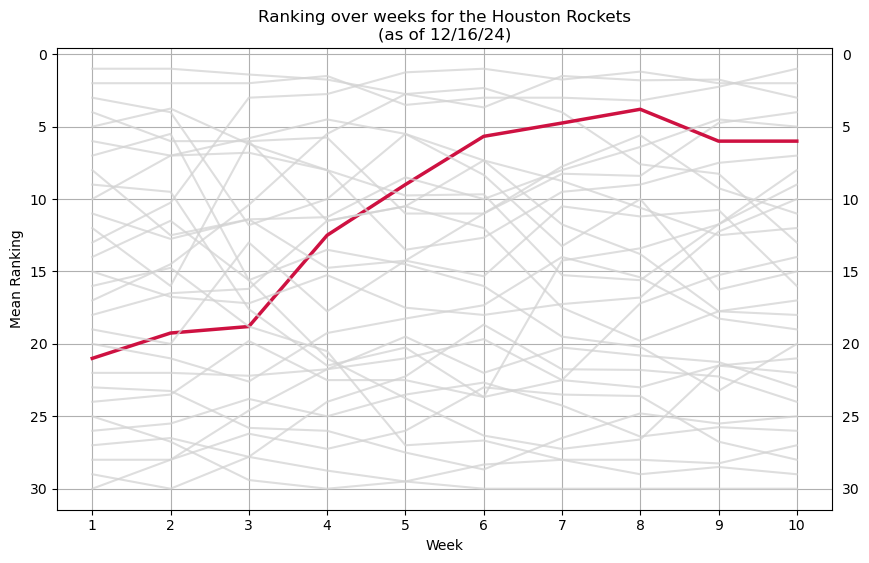
Houston Rockets
Through this point, the Rockets’ season looks like the Warriors’, just set two weeks back. They made it to the semis of the NBA Cup, and have spent the last several weeks trading off with Memphis for the 2-seed in the West. We’ll see if bouncing out of the cup induces a dip and keeps the Warriors parallels going.
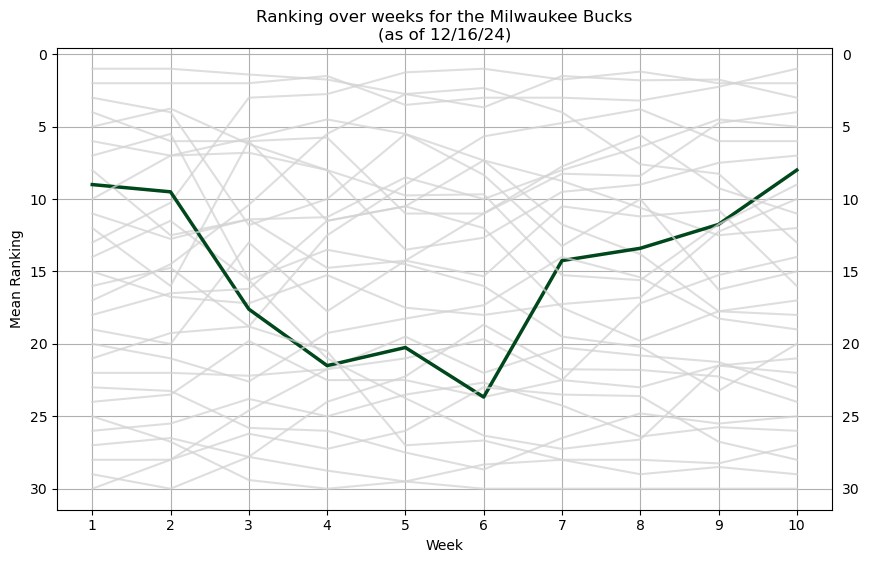
Milwaukee Bucks
As I am writing this on the day of the NBA Cup final, Milwaukee is riding an impressive rebound. Things got bleak (like 76ers bleak) with a dreadful start to the season, but this team is on a roll now.
The Numbers
Table
Here’s the full table. I am putting it under a toggle because it’s kind of monstrous. Open at your peril!
Full Table
| 1 | 1 | 1 | 2 | 2 | 2 | 3 | 3 | 3 | 4 | 4 | 4 | 5 | 5 | 5 | 6 | 6 | 6 | 7 | 7 | 7 | 8 | 8 | 8 | |
|---|---|---|---|---|---|---|---|---|---|---|---|---|---|---|---|---|---|---|---|---|---|---|---|---|
| rnk | rng | rec | rnk | rng | rec | rank | rng | rec | rnk | rng | rec | rnk | rng | rec | rnk | rng | rec | rnk | rng | rec | rnk | rng | rec | |
| ATL | 22.0 | 2 | 2-1 | 22.2 | 6 | 1-3 | 21.75 | 7 | 1-3 | 21.0 | 3 | 2-1 | 19.67 | 1 | 1-2 | 22.5 | 3 | 3-1 | 17.2 | 2 | 3-1 | 15.25 | 3 | 1-1 |
| BOS | 1.0 | 0 | 3-0 | 1.4 | 2 | 3-1 | 1.75 | 2 | 3-1 | 2.75 | 3 | 2-1 | 3.67 | 1 | 3-0 | 1.5 | 1 | 2-1 | 1.8 | 1 | 3-1 | 1.75 | 2 | 2-0 |
| BKN | 28.0 | 3 | 1-2 | 24.6 | 7 | 2-2 | 21.75 | 1 | 1-2 | 19.5 | 3 | 1-3 | 22.0 | 3 | 2-1 | 20.25 | 2 | 2-2 | 20.8 | 3 | 1-2 | 21.25 | 2 | 0-1 |
| CHA | 25.5 | 2 | 1-2 | 23.8 | 7 | 1-2 | 25.0 | 4 | 2-2 | 23.5 | 3 | 1-2 | 22.67 | 1 | 1-2 | 24.25 | 1 | 0-4 | 26.4 | 1 | 1-3 | 25.75 | 1 | 0-1 |
| CHI | 23.5 | 3 | 1-2 | 19.8 | 13 | 2-1 | 22.5 | 5 | 1-3 | 22.5 | 6 | 1-3 | 23.67 | 3 | 2-2 | 22.5 | 1 | 1-2 | 23.0 | 2 | 2-2 | 21.5 | 1 | 1-0 |
| CLE | 10.25 | 3 | 3-0 | 3.0 | 3 | 4-0 | 2.75 | 1 | 4-0 | 1.25 | 1 | 4-0 | 1.0 | 0 | 2-1 | 1.75 | 2 | 1-2 | 1.2 | 1 | 3-1 | 2.0 | 2 | 1-0 |
| DAL | 6.0 | 2 | 1-1 | 6.0 | 4 | 3-1 | 5.75 | 3 | 1-3 | 11.0 | 3 | 2-2 | 11.0 | 7 | 2-1 | 8.25 | 5 | 4-0 | 8.4 | 6 | 3-0 | 4.75 | 2 | 1-1 |
| DEN | 4.0 | 2 | 0-2 | 11.8 | 10 | 3-1 | 10.0 | 5 | 4-0 | 5.5 | 3 | 0-2 | 7.33 | 2 | 2-1 | 8.75 | 6 | 1-2 | 10.6 | 2 | 2-2 | 12.5 | 4 | 1-0 |
| DET | 26.5 | 4 | 0-3 | 27.8 | 1 | 2-2 | 24.0 | 2 | 2-2 | 22.25 | 7 | 3-1 | 18.67 | 3 | 0-3 | 21.75 | 6 | 2-2 | 21.8 | 3 | 1-2 | 22.25 | 3 | 0-1 |
| GSW | 14.5 | 2 | 2-1 | 10.4 | 7 | 3-0 | 5.5 | 4 | 3-1 | 2.75 | 2 | 2-0 | 2.33 | 1 | 2-2 | 4.0 | 2 | 0-3 | 7.6 | 2 | 2-2 | 8.25 | 4 | 0-2 |
| HOU | 19.25 | 3 | 1-2 | 18.8 | 10 | 2-1 | 12.5 | 6 | 3-1 | 9.0 | 6 | 4-0 | 5.67 | 2 | 2-2 | 4.75 | 1 | 3-0 | 3.8 | 1 | 1-2 | 6.0 | 2 | 1-1 |
| IND | 11.5 | 6 | 1-2 | 15.6 | 3 | 1-2 | 13.5 | 4 | 3-1 | 14.5 | 7 | 1-2 | 16.0 | 2 | 1-3 | 19.5 | 1 | 2-2 | 20.2 | 4 | 1-3 | 23.25 | 4 | 2-0 |
| LAC | 20.0 | 2 | 2-1 | 13.0 | 10 | 0-3 | 17.75 | 4 | 4-0 | 14.25 | 2 | 1-3 | 15.33 | 1 | 4-0 | 10.5 | 4 | 2-2 | 11.2 | 8 | 1-2 | 10.75 | 2 | 0-1 |
| LAL | 16.0 | 6 | 3-0 | 6.0 | 7 | 1-2 | 11.5 | 8 | 2-2 | 10.5 | 5 | 3-0 | 7.33 | 3 | 1-2 | 11.75 | 7 | 2-2 | 13.8 | 4 | 1-3 | 17.75 | 3 | 1-1 |
| MEM | 12.5 | 6 | 2-1 | 11.4 | 4 | 2-2 | 11.25 | 5 | 3-1 | 8.5 | 1 | 1-2 | 10.0 | 2 | 2-1 | 8.0 | 4 | 4-0 | 6.4 | 4 | 3-1 | 4.5 | 1 | 1-1 |
| MIA | 16.75 | 3 | 1-1 | 17.2 | 4 | 2-1 | 15.25 | 6 | 1-3 | 17.5 | 3 | 1-2 | 18.0 | 0 | 2-0 | 17.25 | 1 | 2-2 | 16.8 | 3 | 3-1 | 12.25 | 3 | 1-0 |
| MIL | 9.5 | 3 | 1-2 | 17.6 | 7 | 0-3 | 21.5 | 11 | 1-3 | 20.25 | 8 | 2-1 | 23.67 | 4 | 4-0 | 14.25 | 5 | 2-0 | 13.4 | 3 | 2-2 | 11.75 | 7 | 2-0 |
| MIN | 7.0 | 5 | 2-1 | 6.8 | 5 | 1-2 | 8.0 | 4 | 3-1 | 9.75 | 7 | 2-2 | 9.67 | 7 | 0-2 | 15.25 | 3 | 1-2 | 15.6 | 4 | 3-1 | 11.75 | 5 | 2-0 |
| NOP | 14.75 | 5 | 2-1 | 18.8 | 8 | 1-3 | 20.5 | 9 | 0-3 | 27.0 | 2 | 1-3 | 26.67 | 1 | 0-3 | 28.0 | 3 | 0-4 | 29.0 | 0 | 1-3 | 28.5 | 1 | 0-2 |
| NYK | 3.75 | 3 | 1-1 | 6.2 | 3 | 2-1 | 8.0 | 6 | 1-3 | 13.5 | 3 | 3-1 | 12.67 | 1 | 2-1 | 9.5 | 3 | 3-1 | 9.0 | 2 | 2-1 | 7.5 | 1 | 2-1 |
| OKC | 2.0 | 0 | 3-0 | 2.0 | 0 | 3-0 | 1.5 | 1 | 2-2 | 3.5 | 2 | 3-1 | 3.0 | 2 | 1-1 | 3.0 | 2 | 3-1 | 3.2 | 1 | 3-0 | 2.25 | 2 | 2-0 |
| ORL | 12.75 | 1 | 2-1 | 11.4 | 5 | 1-3 | 14.75 | 6 | 2-2 | 14.25 | 7 | 3-0 | 11.0 | 5 | 3-1 | 7.75 | 3 | 4-0 | 5.6 | 2 | 2-2 | 9.25 | 5 | 0-2 |
| PHI | 5.5 | 4 | 1-2 | 15.6 | 10 | 0-2 | 21.0 | 14 | 1-3 | 23.75 | 4 | 0-3 | 26.33 | 1 | 1-3 | 27.25 | 1 | 1-1 | 26.6 | 1 | 3-1 | 21.5 | 6 | 0-1 |
| PHO | 7.0 | 2 | 2-1 | 5.8 | 3 | 3-0 | 4.5 | 1 | 3-1 | 5.5 | 1 | 1-3 | 8.33 | 7 | 0-2 | 13.25 | 5 | 2-1 | 10.0 | 4 | 1-3 | 16.25 | 3 | 2-0 |
| POR | 28.0 | 3 | 1-2 | 26.2 | 4 | 1-3 | 27.25 | 3 | 1-3 | 26.0 | 3 | 3-0 | 23.0 | 2 | 1-2 | 23.5 | 6 | 1-3 | 23.6 | 2 | 0-3 | 26.75 | 3 | 0-2 |
| SAC | 16.5 | 3 | 0-2 | 16.2 | 8 | 3-1 | 11.5 | 4 | 3-1 | 10.5 | 8 | 2-2 | 12.0 | 3 | 0-3 | 17.5 | 2 | 1-3 | 19.8 | 1 | 3-1 | 17.75 | 3 | 1-0 |
| SAS | 21.0 | 3 | 1-1 | 22.6 | 6 | 2-2 | 19.25 | 3 | 1-3 | 18.25 | 5 | 2-2 | 17.33 | 3 | 3-0 | 14.0 | 2 | 2-1 | 15.4 | 4 | 1-3 | 18.25 | 3 | 1-1 |
| TOR | 23.25 | 2 | 1-2 | 25.8 | 6 | 1-3 | 26.0 | 5 | 0-4 | 27.5 | 2 | 0-3 | 28.67 | 1 | 2-1 | 26.5 | 3 | 2-2 | 24.8 | 1 | 1-2 | 25.5 | 3 | 0-2 |
| UTA | 26.75 | 2 | 0-2 | 29.4 | 1 | 0-4 | 30.0 | 0 | 2-1 | 29.5 | 1 | 1-3 | 28.33 | 1 | 1-2 | 28.0 | 3 | 0-4 | 28.0 | 0 | 1-2 | 28.25 | 2 | 0-1 |
| WAS | 30.0 | 0 | 0-2 | 27.8 | 6 | 2-1 | 28.75 | 1 | 0-3 | 29.5 | 1 | 0-4 | 30.0 | 0 | 0-3 | 30.0 | 0 | 0-3 | 30.0 | 0 | 1-3 | 30.0 | 0 | 0-2 |
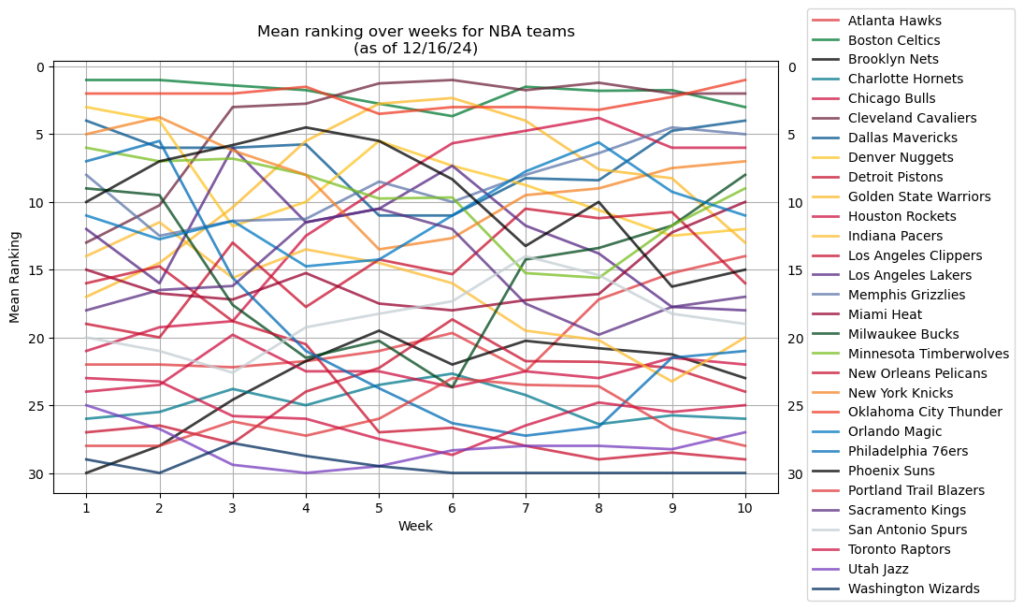
It started from power ranking data that I parsed by scraping influential and respected sports media outlets. For each week of the season, I gathered this data and aggregated it by looking at the week’s mean, min, max, and range for each team.
Then, I scraped Basketball Reference data to compare the power ranking standings to the actual NBA standings. Future installments of this series will feature a comparison of these metrics — standings and power rankings — and see what bearing the former has on the latter.
I used this ever-growing dataset to create visualizations using Matplotlib, creating functions to display league-wide trends as well as those to provide greater focus on individual teams.
| Source | Count |
|---|---|
| Bill Simmons Pod | 1 |
| BR | 7 |
| CBS | 6 |
| ESPN | 9 |
| NBA | 8 |
| The Ringer | 1 |
| TheScore | 5 |
Next Up
I’ll be back in several weeks with another installment.
Here are some items on my roadmap:
- Make visualizations interactive
- I want to animate the visualizations so you can see the season as it develops
- I want to be able to easily select a certain team or teams to examine their trajectories within the context of the league as a whole
- Filter views by conference or standing position (show who rises into or falls out of the top five, for instance)
- Additional explorations /or visualizations
- Correlation between real standings and power rankings
- Exploring teams with similar — or contrasting — trajectories
- Exploring teams whose performances have or haven’t been consistent despite injuries
- Exploring the effect of strength of schedule, road-vs-home, and other standings considerations that go beyond simple wins and losses
- Exploring if any advanced stats correlate particularly strongly with power ranking
- Add annotations, so I can label key inflection points of the team’s season (i.e. injuries, trades, personnel changes) on the team’s line chart
Leave a Reply